
In an age where digital footprints shape our online experiences, a pressing question has arisen among travelers… Will my browser history increase my prices when I revisit a travel website? We undertook research and analyzed the pricing strategies of major American travel websites. The study aims to find out whether users who frequently search for the same travel deals experience higher prices.
The study targeted top travel companies in the United States, identified through Semrush’s travel and tourism website traffic analysis. Next, I used two different Google Chrome accounts for my research. Browser A kept cookies and cache to simulate the experience of a normal user. In contrast, Browser B completely cleared all history, cookies, cache, and site data during the search and displayed a new user profile. Both browsers performed the same price search with matching date, Wi-Fi network, and location settings to ensure a controlled comparison.
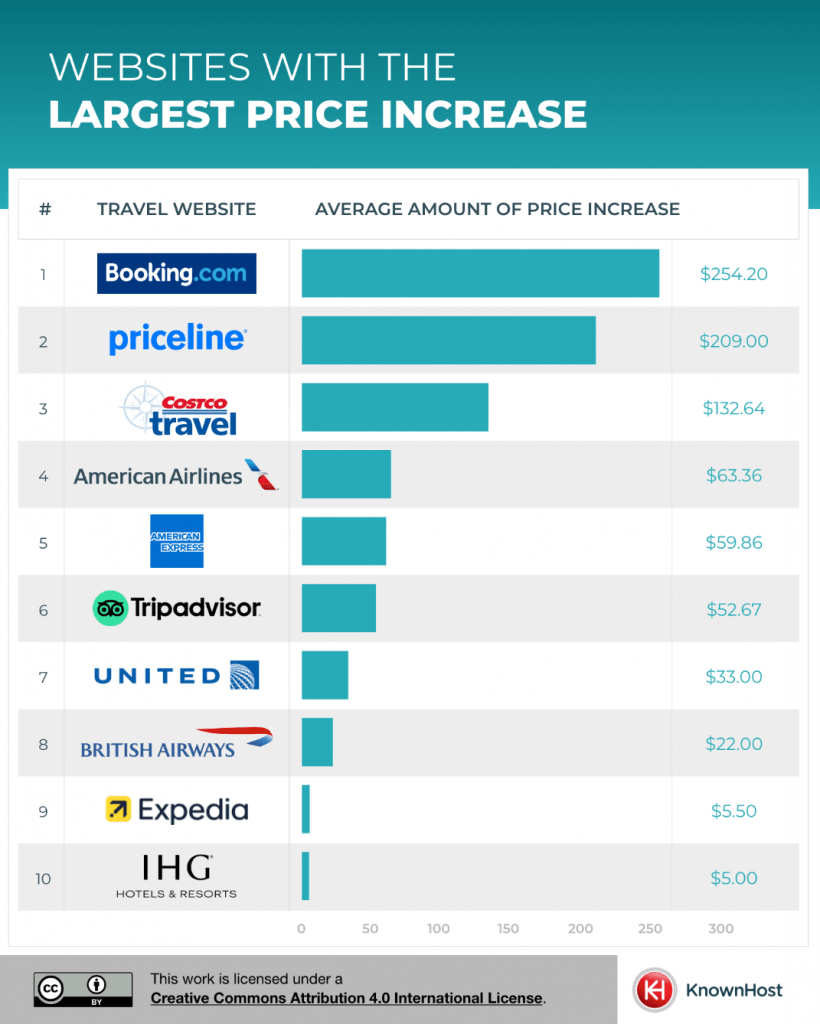
Booking.com – 1st place
With an impressive average price increase of $254.20, Booking.com’s strategy appears to be heavily leveraging users’ browsing history. This price increase may reflect Booking.com’s advanced algorithms and market position, which allows it to proactively customize prices based on user interests and demand patterns.
Price line – 2nd
Next, Priceline’s average markup of $209.00 suggests a similar but slightly less aggressive approach compared to Booking.com. This suggests that while Priceline uses browsing history to inform pricing, it may also be balancing other factors such as competitive pricing and customer retention strategies.
Costco Travel – 3rd place
Costco Travel’s average price increase was $132.64, which is lower than the top two companies but shows that user data is heavily used to adjust prices. This likely reflects Costco Travel’s focus on leveraging user behavior to optimize pricing, likely due to its unique position as part of a large wholesale retail brand. there is.
AA (4th place) & American Express (5th place)
Both airlines saw significant price increases, to $63.36 and $59.86, respectively. These numbers suggest that airlines’ websites may be more conservative in their use of dynamic pricing compared to hotel and travel booking platforms. However, we still acknowledge the importance of user data in pricing.
The rest of the top 10:
TripAdvisor – #6
The $52.67 increase for TripAdvisor, which ranks 6th, represents a more moderate use of browser history. This may reflect TripAdvisor’s role as a review and booking aggregator, where the balance between user trust and revenue optimization is important.
United Airlines – 7th place
United’s approach of a $33.00 increase suggests that the impact of browsing data is moderate. This may be indicative of the airline industry’s overall strategy, which tends to be more conservative in price adjustments compared to other travel industries.
British Airways – 8th place
British Airways’ smaller increase of $22.00 indicates a more conservative approach. This may be due to brand positioning and customer base, or a strategic decision to focus on other aspects of the customer experience other than pricing.
Expedia – 9th place
Expedia’s minimal price increase of $5.50 suggests a limited but existing use of dynamic pricing. This may be a strategic choice to maintain price stability and customer loyalty, indicating a difference in priorities in their business models.
IHG – 10th place
The least impactful price increase at IHG, $5.00, indicates potential for minimal reliance on browser data for pricing. This could be part of IHG’s strategy to emphasize consistent and transparent pricing to build customer trust and loyalty.
In summary, these rankings show that travel and airline websites employ varying degrees of dynamic pricing strategies. They range from aggressive price customization to more conservative strategies that prioritize customer trust and price stability, reflecting each company’s unique market position and business model priorities.
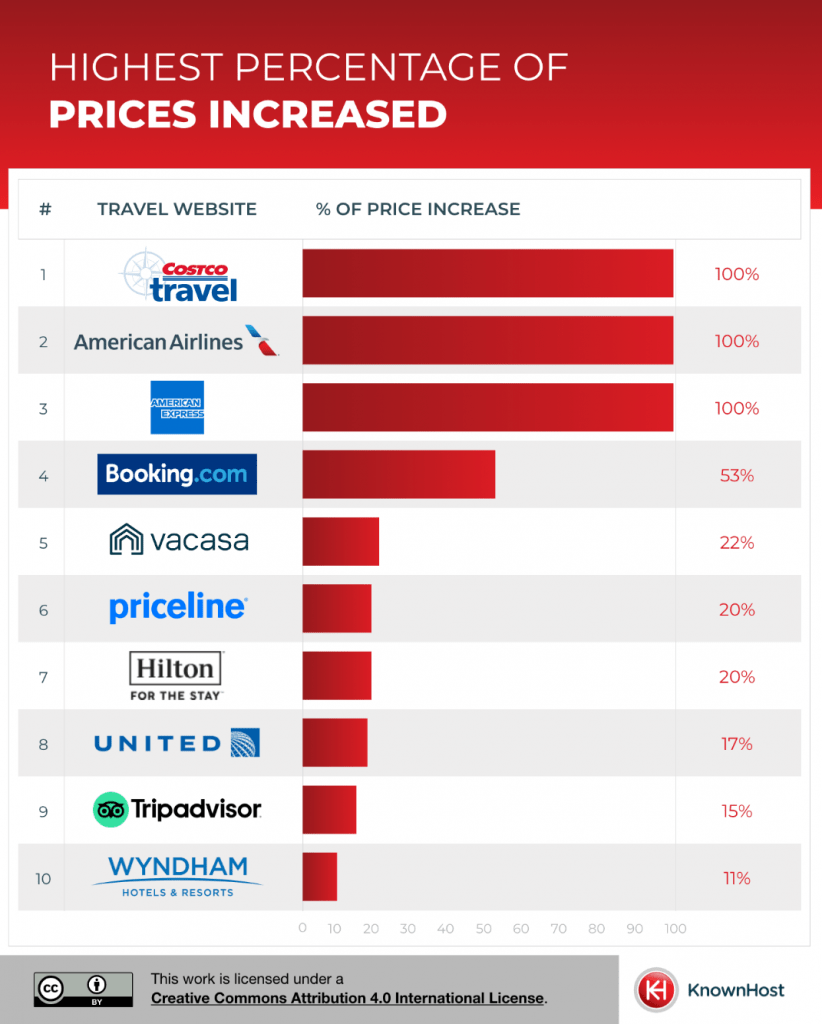
Costco Travel – 1st place
Costcotravel.com’s 100% growth rate is a strong indication that it relies heavily on search history for pricing. This dramatic change may suggest that Costco Travel is adopting an aggressive dynamic pricing model to capitalize on consumer interest and willingness to pay. This may reflect a broader business model focused on customized products.
AA (2nd place) & American Express (3rd place)
With both showing 100% growth rates, these platforms appear to have very sensitive pricing models based on users’ browsing history. This strategy may reflect the company’s approach to capturing maximum value from customers who show repeat interest, and likely focuses on revenue management in the highly competitive airline and credit card related travel services sectors. It shows that you are guessing.
Booking.com – 4th place
With a growth rate of 53%, Booking.com’s strategy appears to be a delicate balance between aggressive dynamic pricing and remaining competitive. This percentage suggests that while Booking.com relies heavily on user data to set prices, it may also be mindful of market competition and the risk of alienating price-sensitive customers. .
Vacasa – 5th place
The 22% increase, although less consistent, shows the potential for applying dynamic pricing based on user data. This may reflect Vacasa’s position in the vacation rental market, where pricing flexibility may be used as a tool to optimize occupancy and revenue, especially in response to fluctuating demand. be.
The rest of the top 10:
Price line – 6th place
A 20% price increase suggests a heavy reliance on browsing data, although not universally. This may reflect Priceline’s strategy to balance dynamic pricing with the need to remain attractive in the competitive online travel agency market.
Hilton – 7th place
The 20% increase may also indicate that Hilton’s approach is strategically using browsing history to influence prices to some extent. This is likely part of Hilton’s broader customer relationship and pricing strategy, which balances personalized pricing with brand loyalty incentives.
United Airlines – 8th place
United Airlines’ 17% price increase may indicate a modest but strategic use of dynamic pricing based on user behavior. This price likely reflects United Airlines’ approach to optimizing revenue per passenger while maintaining a competitive fare structure in the airline industry.
TripAdvisor – 9th place
TripAdvisor’s rankings increased by 15%, suggesting a gradual trend toward adjusting prices based on viewing data. This may be part of a strategy to leverage user data to maximize revenue and balance user trust as a review aggregator and booking platform while offering competitive pricing.
Wyndham Hotel – 10th place
Wyndham Hotels’ 11% increase indicates the least reliance on dynamic pricing strategies among the top 10. This may reflect Wyndham’s focus on maintaining stable pricing to maintain brand consistency and loyalty, and a more traditional approach in the hotel industry. there is.
This study highlights the important role that browser history plays in shaping travel prices on various websites. The findings show that travelers need strategic browsing habits, such as using different devices and regularly clearing their browser’s cookies, to find more favorable pricing options. It suggests something. In the rapidly evolving digital landscape of travel, staying informed and adapting leads to smarter, more cost-effective travel planning.
methodology:
Data collection involved collecting prices from the first page of each identified website on two different days using browsers with and without existing cookies and cache. . This approach allowed us to compare data in a controlled environment while maintaining consistency in network, location settings, and search parameters. We aimed to provide a nuanced, data-driven perspective on how travel websites adjust their prices depending on users’ browsing behavior.
Complete data collection method:
- Look at the prices on the first page of each site.
- Run this scraping twice on different days to see if the prices are different when you clear one browser.
- Compare the data collected from both devices.
Sites used: Top travel companies/travel manufacturers in the United States were identified through the following sample source – https://www.semrush.com/trending-websites/us/travel-and-tourism
device: Use the same advice for each browser search to minimize hardware differences.
- Browser A: Use existing cookies and cache to complete both price searches on the browser
- Browser B: Clear all browser history, cookies, cache, and other site data between price searches.
browser: Use two different Google Chrome accounts.
Communication network: Use the same Wi-Fi network for all price searches to ensure IP consistency.
Location information settings: Made sure the location setting (US VPN) was consistent when searching for prices.
search parameters
Trip starting point (if applicable): JFK Airport, New York
Travel destination:LAX Airport, Los Angeles
Travel schedule:July 12, 2024 – July 19, 2024
Number of travelers:2 adults
Flight/accommodation type:The most basic option available
Results using:First page
First price check date:December 11, 2023
Second price check date:December 13, 2023
